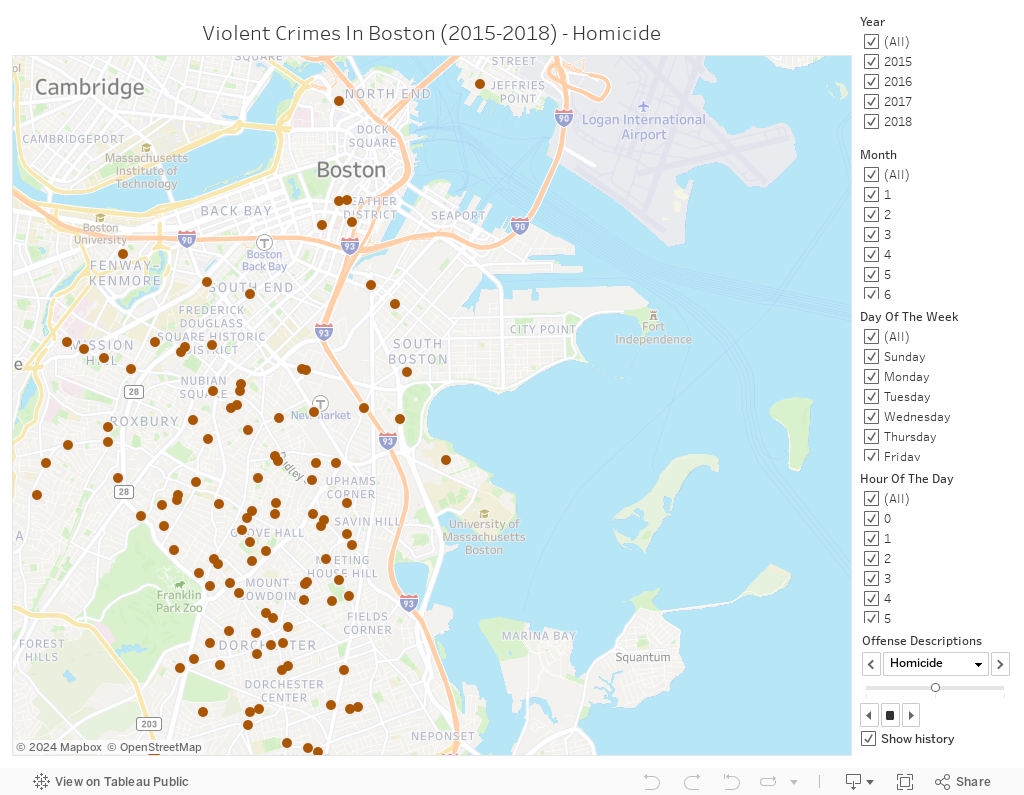
The map below contains the recorded violent crimes in the city of Boston that occurred between 2015-2018. You can use the filters to visualize the crimes by year, month, day of the week, and hour of the day. Use the filter at the bottom of the right column to filter by violent crime.
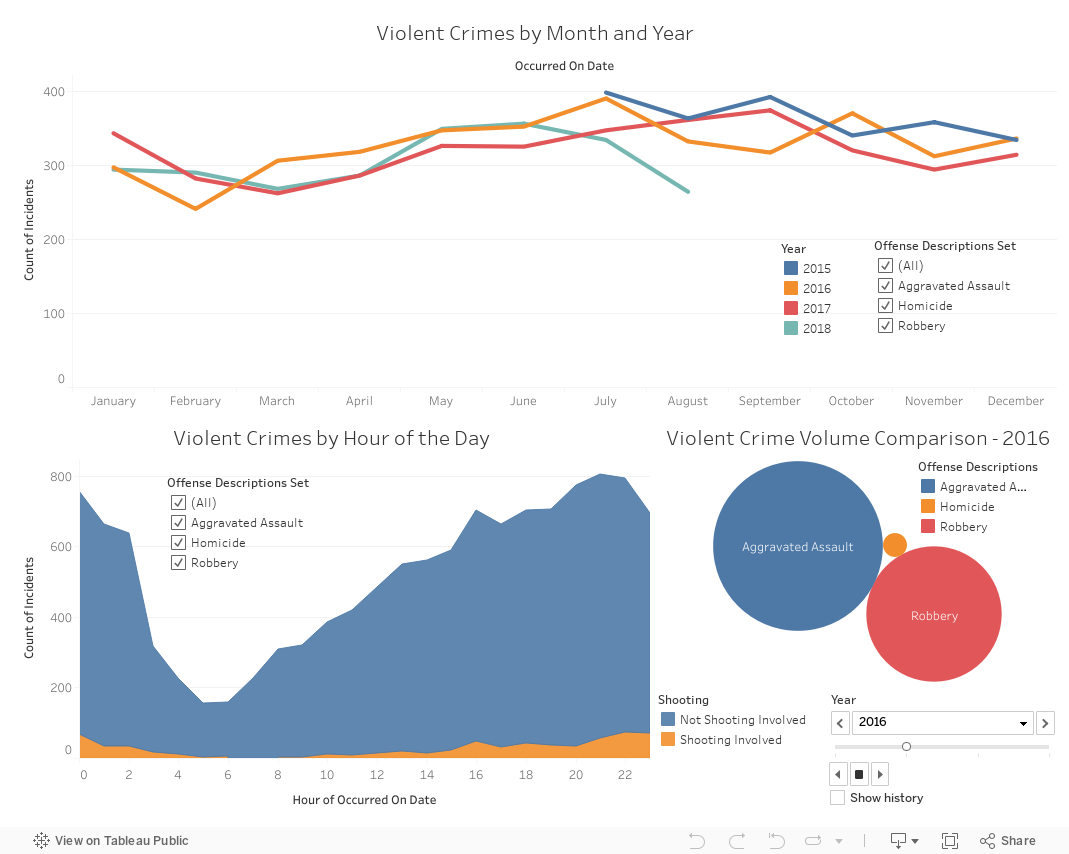
The graphs below let us know more details about the violent crime incidence in the city. We can visualize what violent crime was more common, and how it compares to others. You can use the filters to explore the data and gain more insights into the different crime patterns Boston experienced.
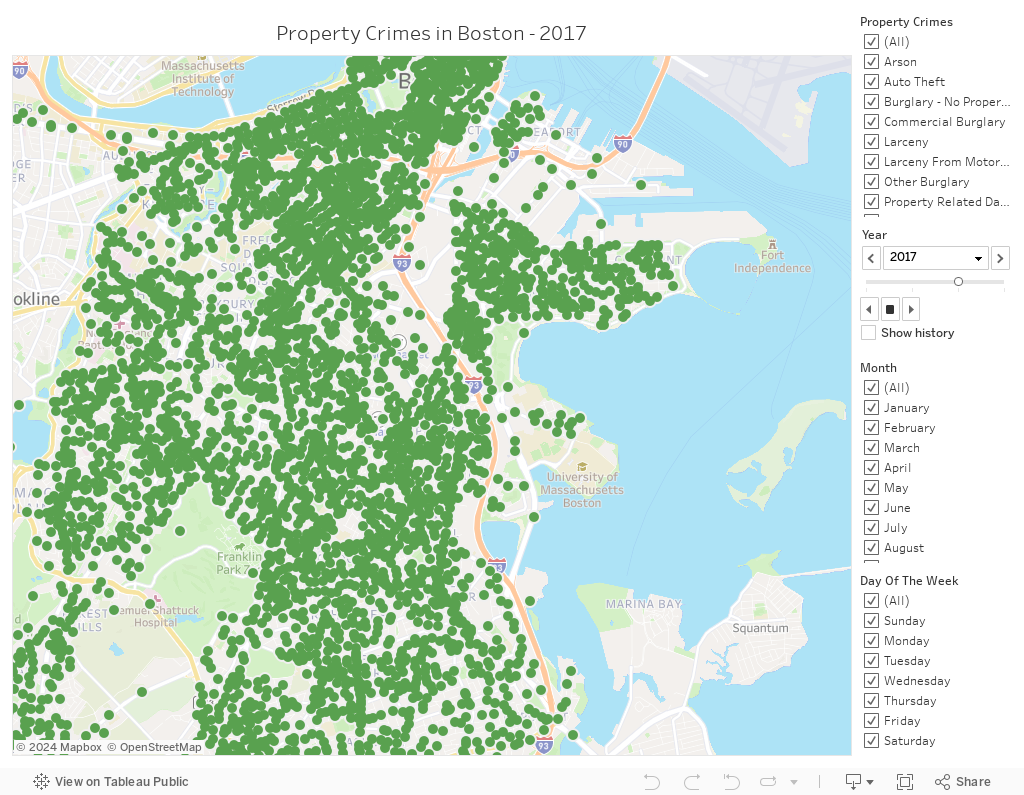
The map below shows the property crime incidents in the city of Boston between 2015-2018. You can use the filters to explore the data.
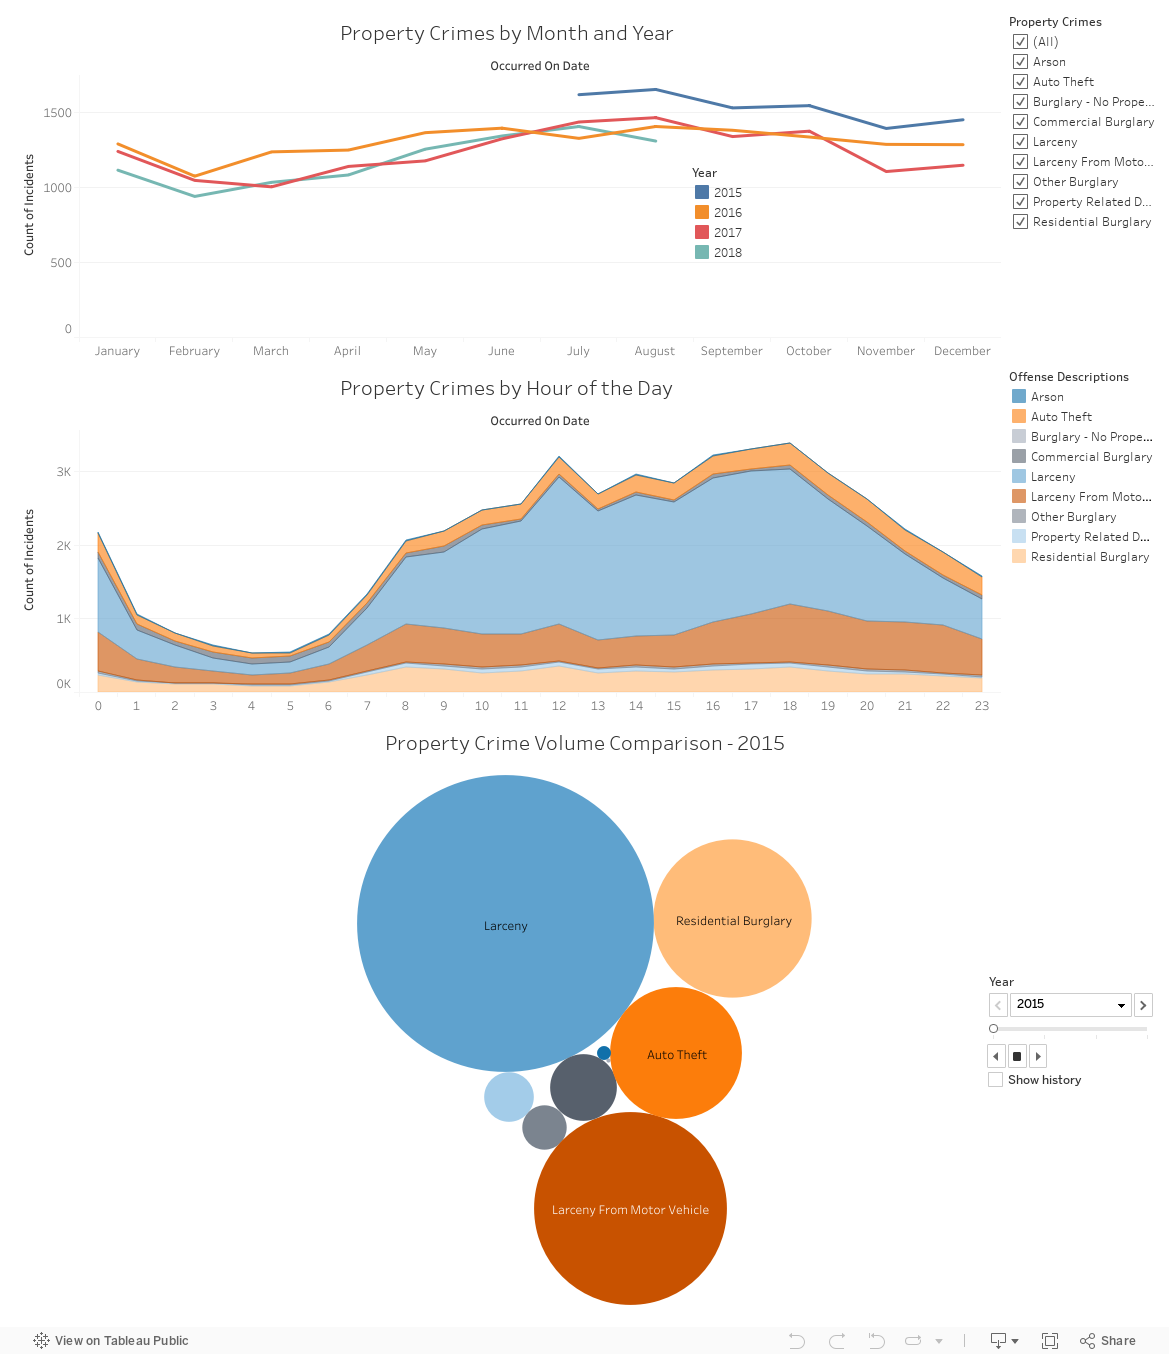
The graphs below give us more information about when property crimes are more prevalent. We can compare the property crime level by year, or by the hour. In addition, we can observe what types of property crimes are more common, and how they compare to the rest.